 loading
They called him “Mr. Bubble.”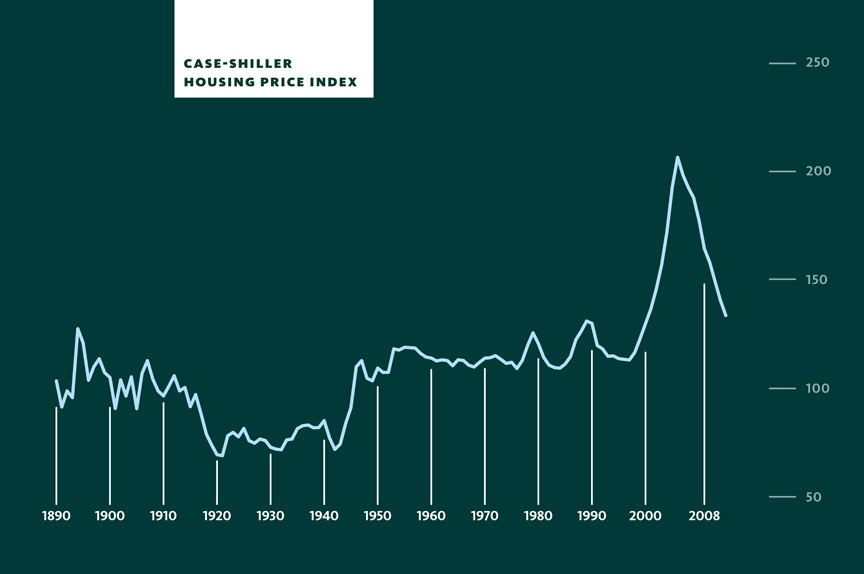 Mark Zurolo ’01MFAIn 1991, Shiller and two other economists created the Case-Shiller index, which tracks housing prices in real time. Early this decade, as the real estate market boomed, Shiller looked for historical data on house prices and found that this basic information didn't exist going back more than a few decades. So he compiled the data himself, from historical sources. View full imageWhen Wall Street analysts talk about the price-earnings ratio -- the P/E ratio -- they generally base their analysis on a very short-term measure of corporate earnings. They typically look at earnings over the past year or at forecasts of earnings over the coming year. They then divide the price of a company's stock by this measure of earnings, to judge whether the stock is fairly valued. The same can be done for the market as a whole: the Standard & Poor 500 index, for instance, divided by the average earnings of the companies in the index. Shiller and John Campbell, a former Shiller student and longtime Harvard professor who now runs Arrowstreet Capital, had come to believe that such measures were fatally flawed. Earnings over any given 12 months can fluctuate wildly, depending on whether the economy is booming or busting. Forecasts of earnings are even more problematic, given Wall Street's unimpressive forecasting record. No P/E ratio based on only 12 months of earnings will tell you much about the long-term prospects of American companies, which is precisely what stock prices are meant to capture. So Shiller and Campbell did something that, on its face, did not make much sense. To get a better glimpse of the future, they looked further in the past. They compared stock prices at any given time with average corporate earnings over the previous ten years. Later on, they would discover that a classic investment textbook, Security Analysis, published in 1934 by Benjamin Graham (a mentor to Warren Buffett) and David Dodd, had advocated this same approach. Investors, Graham and Dodd wrote, should look at earnings for “not less than five years, preferably seven or ten years.” But there is no record that the two men ever published such a data series themselves. Until Shiller and Campbell came along, long-term P/E ratios were virtually absent from public discussion. Their version of the ratio entered the discussion, loudly, in December of 1996. They were both among a group of economists and stock market analysts invited to the Federal Reserve to speak with Greenspan, who was then its chairman. During their presentation, they distributed a handout containing a version of The Chart. Rather than simply showing their P/E ratio over time, this version showed the relationship between the ratio at a given time and the performance of stock prices over the next decade. The pattern was clear: the higher the ratio, the lower that future returns tended to be. Even in late 1996, more than three years before stocks peaked, this pattern was foreboding. The P/E ratio was then above 25, higher than it had been at any time since 1929. Wall Street's standard P/E ratios missed this development, because corporate earnings were also soaring at the time, making the ratio look almost normal. But earnings are highly cyclical. They rarely stay very high for very long. The Shiller-Campbell ratio showed that stock prices were now based on the idea that earnings had reached a new, permanent level. Otherwise, stock prices were headed for a fall. Investors, Shiller told Greenspan, had become irrational. Greenspan listened without betraying his own views, and Shiller headed back to New Haven assuming that he hadn't persuaded the chairman. Three days later, while driving his son to school, Shiller heard a radio report that stocks around the world had begun to drop. Investors were reacting to a speech Greenspan had given at a dinner in Washington the night before. “How do we know,” he asked, “when irrational exuberance has unduly escalated asset values, which then become subject to unexpected and prolonged contractions as they have in Japan over the past decade?” After that one speech, however, Greenspan didn't continue to sound the alarm. Soon enough, stock prices resumed their rise. The long-term P/E ratio peaked at 43 in 2000. If you believed The Chart, stocks were then more than twice as expensive as could be justified by their economic fundamentals. History suggested that they would eventually drop by more than 50 percent. In 2000, only weeks after the market peaked, Shiller published a book making his argument. He called it Irrational Exuberance. The Chart appeared in the first chapter. Over the next few years, Shiller moved on to another subject: housing. In the wake of the dot-com crash, which helped make Shiller a public figure, Americans turned their financial attention from stocks to real estate. House prices were rising rapidly, and people had begun to see real estate as a can't-miss investment. Shiller wanted to know what history might say about that, but he realized that data for house prices didn't exist going back more than a few decades. “Clearly,” he has written, “no one was carefully evaluating the real estate market and its potential for speculative excess.” So he began compiling data himself, from a patchwork of various government surveys and newspaper real-estate advertisements. (In 1991, he and a fellow economist had begun compiling an index to track the market in real time. Known as the Case-Shiller index, it is now among the most closely followed housing statistics.) Shiller's historical data were hardly perfect. The data from 1934 to 1953, based entirely on ads, are “the weakest link,” as Shiller says. But for all their limitations, the numbers still seemed to tell a compelling story. Over the long term, house prices tend to rise at the same rate as household income. If prices increase more slowly than income for a few years, they soon catch up. If they rise more rapidly than income, they eventually come back to earth. In early 2005, Shiller published a second edition of Irrational Exuberance, which added a chart on house prices. That summer -- which turned out to be the very peak of the housing bubble -- Shiller and I had lunch in New York. He told me that day that over the coming generation, he expected inflation-adjusted house prices to decline by 40 percent. In all likelihood, he said, the bursting of the housing bubble would at some point cause a recession.
|

|
 Print
Print Email
Email