 loading
Arts & CultureShining new light—literallyObject lesson: a newly legible map may show how Columbus saw the world. Chet van Duzer is a board member of the Lazarus Project at the University of Mississippi, which brings multispectral imaging to cultural institutions at very low cost. He has published extensively on medieval and Renaissance maps. 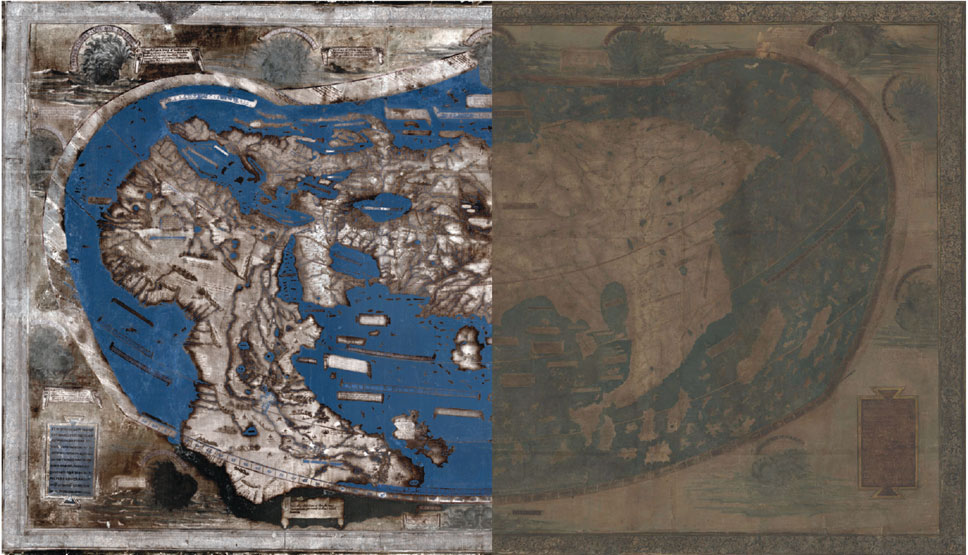 Beinecke Rare Book and Manuscript LibraryThis photoillustration of the Beinecke’s Martellus map (4 by 6.5 feet) shows the map both in its actual, greatly faded condition (right half) and in a digital version (left half) created with multispectral imaging. The map, one of 12,000 in Yale’s pre-1900 map collection, depicts the world from the west coast of Africa to the east coast of Japan. View full imageWhen the map shown here surfaced in Bern in the late 1950s, it was hailed as a missing link in the history of cartography and the best contemporary cartographic representation of the geographical ideas of Christopher Columbus. Good arguments were made that the map had in fact influenced Columbus’s concept of the world’s geography. But almost all of the text had faded to illegibility. No one could read it. The map was clearly made around 1490 by Henricus Martellus, a German cartographer working in Florence. Photographs taken around 1960 with ultraviolet light showed that it was dense with text invisible to the naked eye, but the text remained mostly illegible. The map was donated anonymously to Yale in 1962 and for years hung on the wall near the reference desk in the Beinecke Library. But it remained an enigma. Multispectral imaging was the game-changer. The technology involves taking images at a dozen or so different frequencies of light, ranging from ultraviolet through the visible spectrum and into the infrared, and then digitally combining those images so as to reveal as much text as possible. In August 2014, with the help of a grant from the National Endowment for the Humanities, I gathered a group of imaging scientists from around the country. We spent a week imaging the map in 55 “tiles” that overlapped, so that images of one tile could be digitally stitched together with others. We can now read about 85 percent of the map. It depicts the world from the western coast of Africa in the west to Japan in the east, and it is dotted with texts that describe regions, cities, peoples, animals, and sea monsters. One of the texts in Asia tells us about the Hippopodes, men with the feet of horses. Another, in the Indian Ocean, describes the sea dragon that often fights whales. I was able to determine that many of the texts on animals come from the Hortus sanitatis, an encyclopedia first published in 1491. This allowed us to date the map to 1491 or later. One of the most interesting areas on the map is southern Africa. The place names there reveal that Martellus used some of the same information as another map, the Egyptus Novelo, which drew on data not from European explorers but from native Africans—probably three Ethiopian delegates to the 1441 Council of Florence. But the Martellus map contains a more complete version, and thus is a unique and very important record of the early mapping of Africa by Africans. Most exciting, however, is the prospect of further study. Within the next year the map will be accessible to scholars in ways that it never has been before: all of the multispectral images will be freely available to the public on the Beinecke’s website.
The comment period has expired.
|
|
 Print
Print Email
Email